- /
- Projects/
- Online Chess/
Online Chess

Online Chess Games #
When I saw that Maven Analytics had published a public dataset of online chess games, I knew I would make it into my next project. As a lifelong player of chess, I’ve always wanted to devote myself to the Game of Kings a bit more fully. I’m good enough to beat most of my friends, but chess requires a certain level of dedication to really compete at a higher level. For now, I’m happy that I still play daily, even if it’s just through correspondence games on Chess.com.
For this project, I’ll use Excel to process and analyze the dataset to answer a set of research questions provided by Maven. I’ll also use Excel to create a dashboard of the result.
Description of the Data #
Maven Analytics states this data comes from “20,000+ chess games played on Lichess, including moves, victor, rating, opening details and more”. There’s no way to directly link to the dataset on Maven Analytics’ website, but it can be found in the Data Playground and was published on 01/11/2021.
The data didn’t come with a dictionary explaining each field, so I’ll use my knowledge of the game to fill in the gaps:
game_id- The unique identification number for each game.rated- Whether or not the game was rated (True or False).turns- The number of turns the game lasted.victory_status- How the game ended: checkmate, resignation, draw, out of time.winner- The winner, either Black or White.time_increment- The amount of time alloted to each player.white_id- The unique identifier for the game’s White player, seemingly the player’s Lichess username.white_rating- The ELO Rating of the white player.black_id- The unique identifier for the game’s Black player, seemingly the player’s Lichess username.black_rating- The ELO Rating of the black player.moves- The list of moves for each game as expressed in standard algebraic notation (e.g., 1. d4 d5 2. c4 c6 3. cxd5 e6 etc)opening_code- This uniquely identifies a particular opening and variation. For example, every instance of C50 corresponds to the Italian Variation of the Four Knights Game opening.opening_moves- How many moves each opening consists of.opening_fullname- The full name of the opening (e.g., Four Knights Game: Italian Variation)opening_shortname- The name of the family of openings (e.g., Four Knights Game)opening_response- Whether or not the oponent accepted, refused or declined the proffered opening.opening_variation- The variation of the opening (e.g., Italian Variation)
Research Questions and Analysis #
Maven Analytics offers the following set of research questions for this dataset:
- What percentage of games were won by white? How many ended in a draw?
- Which opening move was most frequently used in games in which black won? What about when white won?
- What percentage of games are won by the player with the higher rating? Does this vary by piece color?
- Which user won the most amount of games? In what percentage of those games was the user the higher rated player?
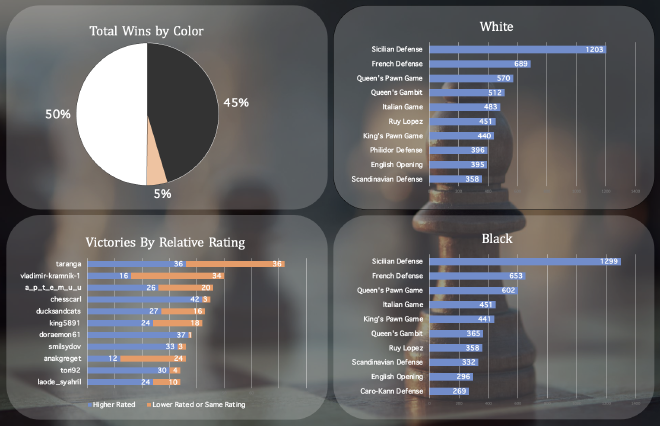
The data already appeared quite clean and clear, so I got to work solving the provided research questions below. I then compiled the charts into this easy-to-read dashboard:

What percentage of games were won by white? How many ended in a draw? #
Of the 20,058 games, White won 10,001 games (49.86%), Black won 9,107 games (45.4%), and 950 games were drawn (4.74%). This is to be expected since White always moves first. Tournaments account for this imbalance by alternating players between White and Black.
Which opening move was most frequently used in games in which black won? What about when white won? #
Going by the opening_shortname field, 136 openings were featured, with the Sicilian Defense being the most used by far at 2,632 games (the second-most used, the French Defense, was only used 1,412 times). Such is the Sicilian’s popularity that it was the most common opening used in games in which Black won and White won and in draws. It very minorly favors Black by about 96 games in the dataset (less than 0.005%).
“Just play the Sicilian” is hardly a satisfying takeaway, so I instead decided to break down the top ten openings for each outcome. The second and third most common openings for Black, White, and Draws are also the same: The French Defense and the Queen’s Pawn Game, respectively. Several other openings are shared between Black and White but at different positions in the top ten; the Italian Game is fourth place for Black and fifth place for White. Similarly, the Queen’s Gambit is in sixth place for Black and fourth for White.
Of particular notice are the openings that show up in the top ten for one player or not the other. The Caro-Kann comes in at tenth place for Black (and 11th for White). The Philador Defense is number eight for White (and 11th for Black).
Can we really draw any useful conclusions from this? With few exceptions, the top ten openings for each player are just a slightly shuffled version of the other’s, and even those differences are quite small. Perhaps we could conclude that, while playing important roles in individual games, openings don’t account for much variation in the grand scheme of things. After all, it’s not as if anyone can become a chess grandmaster by knowing a small handful of openings.
Perhaps we’ll come back and investigate further by accounting for ELO and/or opening variations.
What percentage of games are won by the player with the higher rating? Does this vary by piece color? #
This is tricky to figure out with the data as is; the ratings are stored by player (white_rating and black_rating) rather than by victor and defeated. So I created a new column entitled higher_rating with the following function:
=IF(H2 > J2, "White", IF(J2>H2, "Black", "Same"))
This returns whichever player has the higher rating of the two. If both players happen to share the exact same rating (accounting for 203 games in the entire set), “Same” is returned. I then used that result to determine if the player with the higher rating is the same player who won. I created the winner_higher column with this function:
=IF(E2=K2, TRUE, FALSE)
Of the 20,058 games in the dataset, 12,447 (62%) were won by the player with the higher rating.
Of the 9,017 games won by Black, 5,918 (64.9%) had Black with a higher rating.
Of the 10,001 games won by White, 6,529 (65.2%) had Black with a higher rating.
Unsurprisingly, the more highly-rated player is more likely to win any given match. If there’s anything surprising, it’s just how little this differs by color.
Which user won the most amount of games? In what percentage of those games was the user the higher rated player? #
I created a new column named winner_name calculated with the following:
=IF(E2="White", G2,IF(E2="Black",I2,"Draw"))
Now that all the winners’ names were in one column, we can put the data in a pivot table that spits out the top ten (or twenty, or thirty, etc) players. The user taranga won the most games of anyone in the dataset for a total of 72 victories. Interestingly, they won exactly half of their games as the higher-rated player and exactly half as the lower-rated player.