Google Data Analytics Capstone Project - Cyclistic
Table of Contents
The Google Data Analytics course offers two choices for its final capstone project. I ended up choosing the Bellabeat capstone project, which you can read here. However, I felt that this wasn’t sufficient for my own development as a data analyst. Besides needing a larger portfolio, I also need to demonstrate more competence with SQL and Tableau. I have other projects that I want to complete, but I felt this would be a relatively quick and easy way to address those concerns.
In this project, we have to help Cyclistic, a bikeshare company based in Chicago, convert its casual riders into full members. As a enthusiast of cycling and public transit, I’m very excited to use my skills processing and analyzing data to help solve problems that I think about every day.
Scenario & Business Questions #
The full instructions can be found here. Here’s an extract of the most pertinent information:
You are a junior data analyst working in the marketing analyst team at Cyclistic, a bike-share company in Chicago. The director of marketing believes the company’s future success depends on maximizing the number of annual memberships. Therefore, your team wants to understand how casual riders and annual members use Cyclistic bikes differently. From these insights, your team will design a new marketing strategy to convert casual riders into annual members. But first, Cyclistic executives must approve your recommendations, so they must be backed up with compelling data insights and professional data visualizations.
Characters and teams
- Cyclistic: A bike-share program that features more than 5,800 bicycles and 600 docking stations. Cyclistic sets itself apart by also offering reclining bikes, hand tricycles, and cargo bikes, making bike-share more inclusive to people with disabilities and riders who can’t use a standard two-wheeled bike. The majority of riders opt for traditional bikes; about 8% of riders use the assistive options. Cyclistic users are more likely to ride for leisure, but about 30% use them to commute to work each day.
- Lily Moreno: The director of marketing and your manager. Moreno is responsible for the development of campaigns and initiatives to promote the bike-share program. These may include email, social media, and other channels.
- Cyclistic marketing analytics team: A team of data analysts who are responsible for collecting, analyzing, and reporting data that helps guide Cyclistic marketing strategy. You joined this team six months ago and have been busy learning about Cyclistic’s mission and business goals — as well as how you, as a junior data analyst, can help Cyclistic achieve them.
- Cyclistic executive team: The notoriously detail-oriented executive team will decide whether to approve the recommended marketing program.
[…]
Customers who purchase single-ride or full-day passes are referred to as casual riders. Customers who purchase annual memberships are Cyclistic members.
Cyclistic’s finance analysts have concluded that annual members are much more profitable than casual riders. Although the pricing flexibility helps Cyclistic attract more customers, Moreno believes that maximizing the number of annual members will be key to future growth. Rather than creating a marketing campaign that targets all-new customers, Moreno believes there is a very good chance to convert casual riders into members. She notes that casual riders are already aware of the Cyclistic program and have chosen Cyclistic for their mobility needs. Moreno has set a clear goal: Design marketing strategies aimed at converting casual riders into annual members. In order to do that, however, the marketing analyst team needs to better understand how annual members and casual riders differ, why casual riders would buy a membership, and how digital media could affect their marketing tactics. Moreno and her team are interested in analyzing the Cyclistic historical bike trip data to identify trends.
Three questions will guide the future marketing program:
- How do annual members and casual riders use Cyclistic bikes differently?
- Why would casual riders buy Cyclistic annual memberships?
- How can Cyclistic use digital media to influence casual riders to become members?
Prepare #
The data comes this repository. We’re instructed to take the twelve most recent months of data and use it to answer the above business questions. Since I began this project in May 2023, I used all the data up to that point starting from May 2022. Google then wishes us to evaluate the data based on the ROCCC criteria:
- Reliable: The data seems rather reliable. There are no duplicate rows and not too many null values. Certain data that would be useful (e.g. the Zip codes of members and casual riders) has been excluded due to privacy concerns, but otherwise this data seems like it will easily furnish reliable analysis.
- Original: This data comes from the company itself (or in this case, its non-fictional counterpart Motivate LLC, which runs the Divvy bikeshare system in Chicago), so the data satisfies this criteria.
- Comprehensive: As I mentioned above, the dataset is missing data that would be very useful, but otherwise, I feel the data is complete and provides more than enough information to make a useful analysis
- Current: The data is current and updated on a month basis. Theoretically, I could add the more recent months into this analysis, or even analyze all the data going back to 2013.
- Cited: There’s no explicit citation of this data set. Even the URL is nondescript.
Overall, I’d say this data is quite good, which is a relief compared to the data in the BellaBeat capstone project. I feel very confident moving forward with my analysis using this data.
Process #
I’ve decided to process and clean the data in SQL. After uploading the datasets into BigQuery, I quickly inspected the data to make sure that all the columns and data types matched. Satisfied with the results, I merged all the monthly data into one dataset using the UNION ALL command:
SELECT
  *
FROM
  `cyclistic-393219.Cyclistic.2022-04`
UNION ALL
SELECT
  *
FROM
  `cyclistic-393219.Cyclistic.2022-05`
UNION ALL
SELECT
  *
FROM
  `cyclistic-393219.Cyclistic.2022-06`
UNION ALL
SELECT
  *
FROM
  `cyclistic-393219.Cyclistic.2022-07`
UNION ALL
SELECT
  *
FROM
  `cyclistic-393219.Cyclistic.2022-08`
UNION ALL
SELECT
  *
FROM
  `cyclistic-393219.Cyclistic.2022-09`
UNION ALL
SELECT
  *
FROM
  `cyclistic-393219.Cyclistic.2022-10`
UNION ALL
SELECT
  *
FROM
  `cyclistic-393219.Cyclistic.2022-11`
UNION ALL
SELECT
  *
FROM
  `cyclistic-393219.Cyclistic.2022-12`
UNION ALL
SELECT
  *
FROM
  `cyclistic-393219.Cyclistic.2023-01`
UNION ALL
SELECT
  *
FROM
  `cyclistic-393219.Cyclistic.2023-02`
UNION ALL
SELECT
  *
FROM
  `cyclistic-393219.Cyclistic.2023-03`
UNION ALL
SELECT
  *
FROM
  `cyclistic-393219.Cyclistic.2023-04`
I then extracted useful data from the started_at column, such as the day of the week, the hour in which each trip began, and the trip’s overall duration:
SELECT
  *,
  CASE
  WHEN EXTRACT(DAYOFWEEK from started_at) = 1 THEN 'Sunday'
  WHEN EXTRACT(DAYOFWEEK from started_at) = 2 THEN 'Monday'
  WHEN EXTRACT(DAYOFWEEK from started_at) = 3 THEN 'Tuesday'
  WHEN EXTRACT(DAYOFWEEK from started_at) = 4 THEN 'Wednesday'
  WHEN EXTRACT(DAYOFWEEK from started_at) = 5 THEN 'Thursday'
  WHEN EXTRACT(DAYOFWEEK from started_at) = 6 THEN 'Friday'
  ELSE 'Saturday'
  END AS day_of_week,
  EXTRACT(HOUR from started_at) AS starting_hour,
  EXTRACT(MONTH from started_at) AS month,
  ROUND(TIMESTAMP_DIFF(ended_at, started_at, second)/60, 1) AS trip_duration
FROM
  `Cyclistic.mergedData`
Unfortunately, this process led to a problem where 7,188 trips were recorded as having a duration of less than or equal to 0:
SELECT
  COUNT(*)
FROM
  `Cyclistic.mergedData`
WHERE
  trip_duration <= 0
This might have happened because some trips began on one calendar day and ended in the next (in other words, a trip that lasted past midnight). As these rows only account for 0.1% of the data, removing these trips won’t hurt the analysis too much.
It also came to my attention that there were 1,423,505 null values in the start_station_name and end_station_name fields:
SELECT
  COUNT(*)
FROM
  `Cyclistic.mergedData`
WHERE
  start_station_name IS NULL
  OR
  end_station_name IS NULL
This represents over a sixth of the total data, so these rows can’t be tossed out so easily. I’ll procede with the dataset as-is, but I’ll need to keep this in mind if I plan to use any of this location data later.
Analyze & Share #
I will now use Tableau to analyze the differences between casual riders and members. You can find the whole Tableau workbook here.
I broke down Total Ridership and Average Trip Duration by months, time of day, and days of the week.
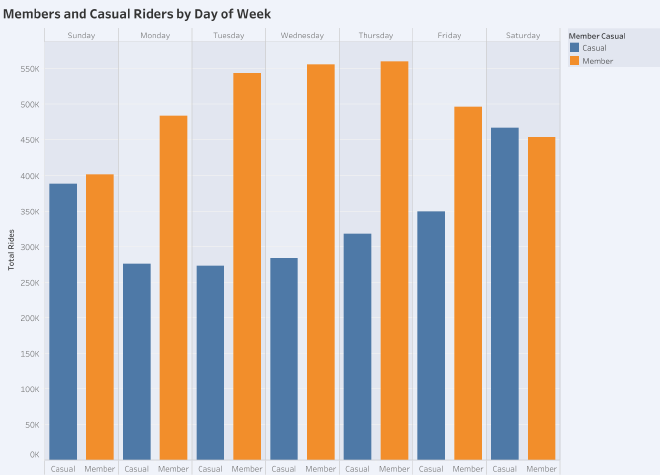
No surprise that casual ridership jumps during the weekend. More interesting is just how many members use the service on the weekdays. This suggests that members are more likely to use the service to commute to and from work.
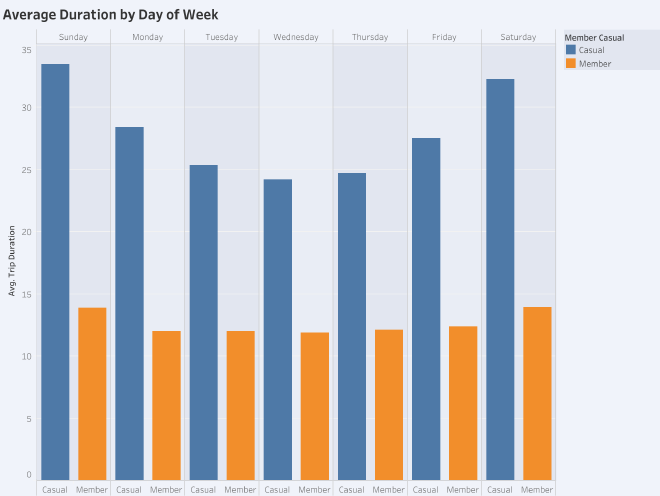
Once again, members are surprising us, this time with their steadiness; even on weekends they barely take longer rides than on weekdays. Members’ relationship to bikes seems less recreational and much more utilitarian than that of their casual counterparts.
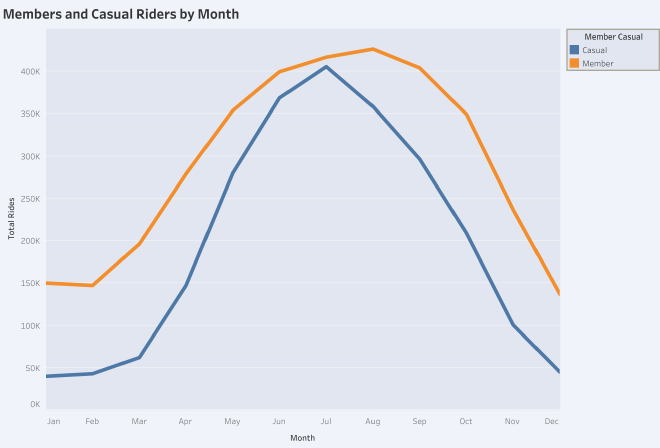
As one might expect, ridership for both types rises in the summer and dips low during Chicago’s famously frigid winters. Casual ridership’s peak in July is around eight times that of its lowest point in January. Members also ride bikes more frequently in the summer, but notice how even in January they take three times as many rides as casual users.
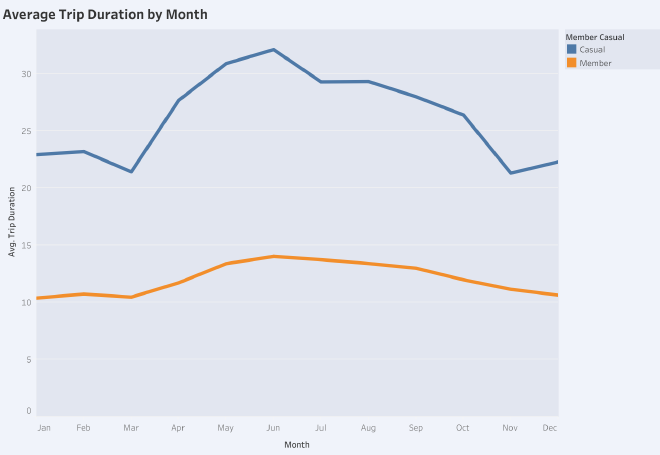
Once again, members keep steadier habits through the year than casual riders. Even in the coldest depths of Chicago’s winters, the average trip duration for members never dips even four minutes lower than the peaks of summer. In fact, it’s rather odd how little the seasons factor into members’ habits.
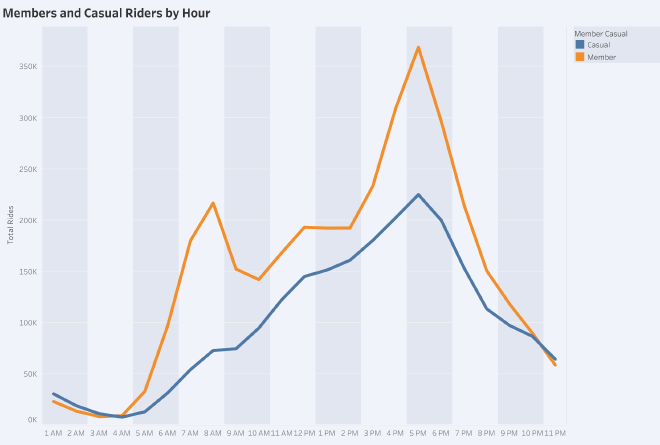
The picture is getting clearer and clearer. Casual ridership ramps up gradually over the course of the day from sunrise to late afternoon, when it gradually tapers of into the evening. Members, on the other hand, wake up early together and peak in ridership during both rush hours. After the afternoon rush, ridership among members drops off sharply.
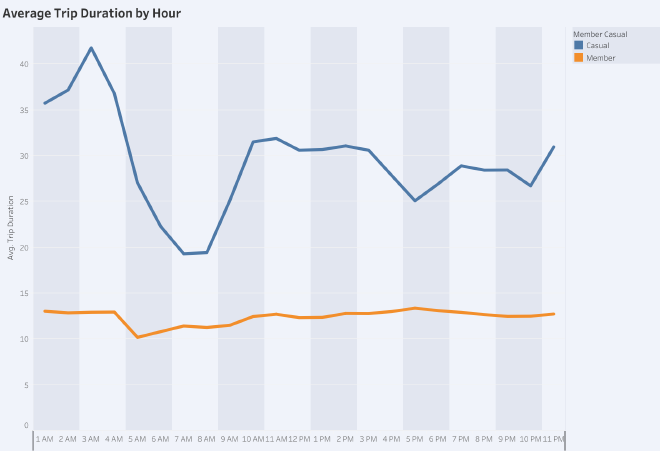
More of the same: casual riders take longer trips that make dramatic swings throughout the day, while members keep trips short and steady throughout.
Conclusions & Recommendations #
Now that we’ve analyzed and visualized the data, we can now answer the questions posed to us at the beginning:
1. How do annual members and casual riders use Cyclistic bikes differently? #
Let’s build up a profile of each type of user:
Casual Riders #
Casual riders view bikeshares in terms of recreation and leisure. Their activity rises and falls with the seasons and the daylight, with a special focus on weekends. They’re either unable or uninterested in using Cyclistic as a day-to-day method of transit.
Members #
Members keep it steady, steady, steady. Their ridership varies through the seasons, but otherwise, they keep the habits of a regular commuter just trying to get to and from work. Cycling is less a pastime for them than it is a way of life.
2. Why would casual riders buy Cyclistic annual memberships? #
Some casual riders are tourists and daytrippers from the suburbs. Short of enticing them to visit Chicago more frequently, there’s probably not much that can be done to convert this market segment into members.
However, I’d wager that many casual riders are residents of Chicago and nearby suburbs who would love to commute by bicycle, but are unable to do so for any number of reasons. Some reasons, such as a lack of bike lanes and other forms of cycling infrastructure, are out of Cyclistic’s hands, but the company could do other things to reduce the friction between these casual members and commuting by bicycle. For example, the company could install more docking stations outside of downtown and more towards the periphery.
As far as marketing goes, Cyclistic could point out the many benefits of commuting by bike: a healthy lifestyle, the lack of traffic, not needing to find and pay for parking in the city. Cyclistic should especially emphasize multi-modal transit; Chicago’s excellent train system reaches far out into the suburbs and even into the neighboring state of Wisconsin, so Cyclistic is perfectly positioned to transform casual riders who currently commute by car into members who solve the problem of the last mile with bike share.
3. How can Cyclistic use digital media to influence casual riders to become members? #
Since members are basically commuters, we need to target casual riders in the Chicago area who currently commute by some other means. Ads can be timed to coincide with rush hours and lunch breaks. For those who commute by rail, ads can be focused on solving the last mile problem with bikeshare. For those commmuting in cars, we can emphasize the many benefits of bikes and multi-modal transit. If possible, Cyclistic should purchase more ads on days with unusually heavy traffic in the Chicago area, when the misery of commuting by car is at the top of everyone’s mind. It might even be worth it to collaborate on this with the city government, who have a strong incentive to reduce car traffic and encourage multi-modal transit.