Lego Set Sales
Table of Contents
Maven Analytics recently hosted a competition to analyze a dataset of Lego releases stretching back to 1970. I’m not a Lego fanatic by any means, but it’s a fandom I’m more than happy to watch from afar, whether they’re stretching their bricks to absolute limit or setting up their ideal Lego studio. One video I’d highly recommend, and which has some particular resonance for this project, would be Slow Start’s documentary about Lego’s Bionicle line and how it possibly single-handedly saved the whole company:
Maven tasked us with creating an interactive dashboard, but since I’m not competing, I figure I’d instead just answer the research questions using Python and Excel. The questions are as follows:
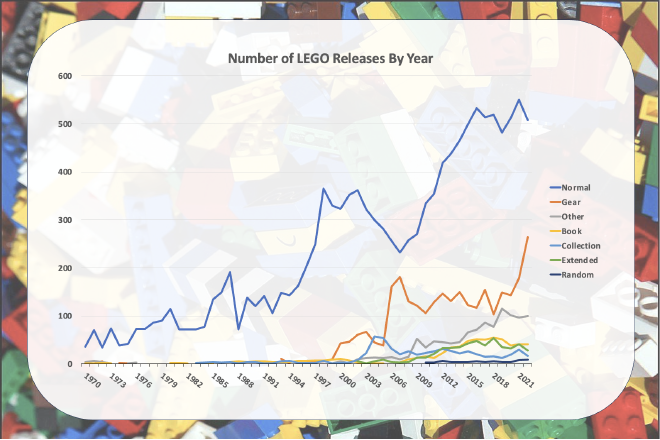
- How many LEGO sets have been released since 1970? Is there a noticable trend?
- Is there a relationship between the price of a set and its number of pieces?
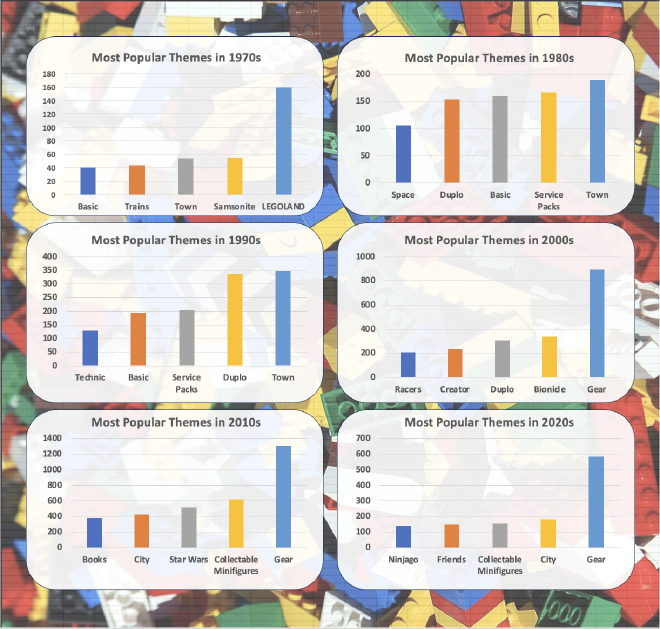
- Which has been the most popular theme in each decade?
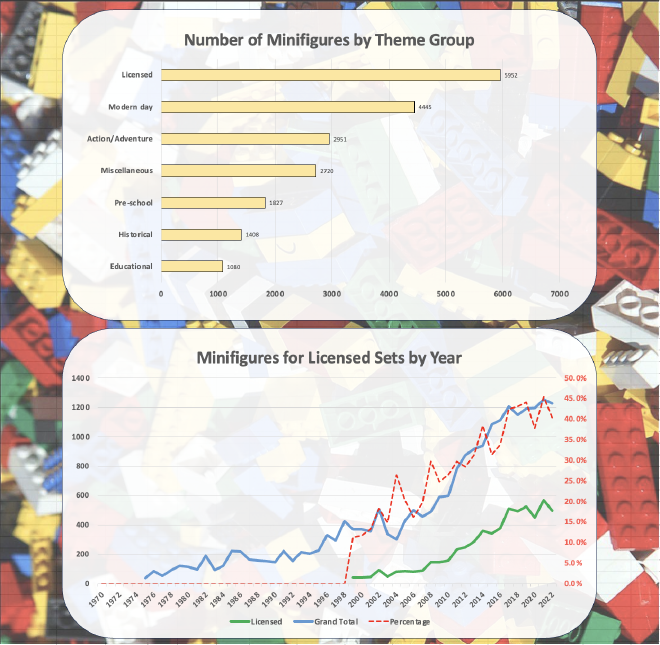
- Are LEGO minifigures most closely tied to licensed sets?
Exploring the Data #
Like more datasets from Maven, the data is already in a pretty usable form. In addition, Maven provided this data dictionary to help us out:
- set_id: Official LEGO item number
- name: Name of the LEGO set
- year: Release year
- theme: LEGO theme the set belongs to
- subtheme: Subtheme within the theme
- themeGroup: Overall group the theme belongs to
- category: Type of set
- pieces: Number of pieces in the set
- minifigs: Number of mini figures included in the set
- agerange_min: Minimum age recommended
- US_retailPrice: US retail price at launch
- bricksetURL: URL for the set on brickset.com
- thumbnailURL: Small image of the set
- imageURL: Full size image of the set
I set up a Jupyter notebook and put in the following commands to make sure that all the data is present.
import pandas as pd
import numpy as np

df = pd.read_csv("lego_sets.csv")

df.info()
<class 'pandas.core.frame.DataFrame'>
RangeIndex: 18457 entries, 0 to 18456
Data columns (total 14 columns):
 #   Column          Non-Null Count  Dtype
---  ------          --------------  -----
 0   set_id          18457 non-null  object
 1   name            18457 non-null  object
 2   year            18457 non-null  int64
 3   theme           18457 non-null  object
 4   subtheme        14901 non-null  object
 5   themeGroup      18455 non-null  object
 6   category        18457 non-null  object
 7   pieces          14533 non-null  float64
 8   minifigs        8399 non-null   float64
 9   agerange_min    6787 non-null   float64
 10  US_retailPrice  6982 non-null   float64
 11  bricksetURL     18457 non-null  object
 12  thumbnailURL    17451 non-null  object
 13  imageURL        17451 non-null  object
dtypes: float64(4), int64(1), object(9)
memory usage: 2.0+ MB
Research Questions #
How many LEGO sets have been released since 1970? Is there a noticable trend? #
According to the data, LEGO has released a total of 18,457 sets since 1970. These can be further broken down by category:
- 12,757 Normal
- 2,832 Gear
- 1,094 Other
- 631 Book
- 578 Collection
- 501 Extended
- 64 Random

Obviously the Normal sets far outnumber all the others combined. More interestingly, none of the other categories records more than a blip until 1998, when Gear begins taking off. It has been the second-best-selling category ever since with a brief exception between 2003 and 2005, when Collection took over. This tracks with the documentary above, which states that Lego had to make big pivots in the late 90s in order to stay relevant to the changing toy market.
Is there a relationship between the price of a set and its number of pieces? #
The correlation between retail price and the number of pieces is 0.867, which is indeed a very strong correlation.
As a sidenote, it’s interesting how low the correlation between year and retail price is; wouldn’t inflation track pretty well with yearly data? This result might be explained by the fact that reliable data on retail price doesn’t appear until 1996. There’s been less than 100% cumulative inflation since then, as opposed to the nearly 700% cumulative inflation since 1970. There’s also the possibility that the visible effects of inflation are diluted in the dataset due to LEGO offering a wider variety of products at different price points.
df.corr(method='pearson', numeric_only=True)
                    year    pieces  minifigs  agerange_min  US_retailPrice
year            1.000000  0.161708  0.045217      0.163378        0.129770
pieces          0.161708  1.000000  0.482633      0.636915        0.867433
minifigs        0.045217  0.482633  1.000000      0.346101        0.535155
agerange_min    0.163378  0.636915  0.346101      1.000000        0.587281
US_retailPrice  0.129770  0.867433  0.535155      0.587281        1.000000
df_retail = df[df["year"] > 1995]
df_retail.corr(method='pearson', numeric_only=True)
                    year    pieces  minifigs  agerange_min  US_retailPrice
year            1.000000  0.144281  0.049893      0.155055        0.129519
pieces          0.144281  1.000000  0.499715      0.637391        0.867426
minifigs        0.049893  0.499715  1.000000      0.344927        0.535155
agerange_min    0.155055  0.637391  0.344927      1.000000        0.587344
US_retailPrice  0.129519  0.867426  0.535155      0.587344        1.000000
Which has been the most popular theme in each decade? #
There are several ways to convert years to decades, but I chose to use Excel to set up a new column called decade and input the following formula:
=(ROUNDDOWN(C2*0.1, 0))*10
Using a couple Pivot Tables, I was able to get the following:

Are LEGO minifigures most closely tied to licensed sets? #
The dataset indicates a very strong link between minifigures and licensed sets; not only do licensed sets have more minifigures than any other theme, but the the percentage of all minifigures that are found in licensed sets has risen from a little under 12% in 1999 to nearly half in 2022 and 2023. This makes sense, of course; what would a Hogwarts set be without Harry Potter, or a Death Star set without Darth Vader?

Further Research #
I’d like to return to this dataset soon to set up an interactive dashboard, perhaps with Tableau. I’d also like to dig in to the specfic years in which the original Bionicles line was running to gain further insights about the era.